As I have mentioned before in my blog posts, good visualization has a vital role in the success of a presentation. With the rise in the popularity of infographics, many presentation designers usually choose to include infographics and illustrations in their slides. In recent updates of PowerPoint, it is now much easier for users to do that, as long as you know how to use vector graphics in PowerPoint.
First and foremost, we could start with some basic knowledge about vector graphics :).
What is vector graphic?
There are two major types of images: vector and raster. As you may already notice, images exist with different file formats, such as JPG, PNG, GIF, TIF, EPS, SVG. These file formats are categorized as either vector or raster files.
What is the difference between vector and raster images?
Raster images
Raster images are made up of small, individual colored blocks called pixels. They often appear in the form of JPGs, PNGs, GIFs or TIFs. As the size of a raster image increases, it cannot retain its appearance. The photo could be blurry, or pixelated as you zoom in or increase its size. Photographs are the major part of raster images.
Vector images
Alternatively, vector images are formed by mathematic equations and geometric primitives (points, lines, and shapes). Vector graphics often appear in the form of EPSs, SVGs, AIs or PDFs. Vector graphics usually allow for more flexibility, since you can stretch them to whichever size you want without the loss of quality. Therefore, they are usually used for logos, icons and charts design.
What are the benefits of vector graphics?
The most important advantage of vector graphics is that you can resize infinitely to any size of applications. Vector graphics are quite lightweight compared to raster images.
Besides, there are plenty of free resources for vector graphics that could significantly help in creating infographics and illustrations. Some notable online resources of vector graphics are:
- Vexels (https://www.vexels.com/)
- Freepik (http://www.freepik.com/)
- Flaticon (http://www.flaticon.com/)
There are also a lot of beautiful and vivid vector graphics, though not for free, in ShutterStock (https://www.shutterstock.com/).
How to edit raster images or photographs were once introduced in our blog post, Photo editing in PowerPoint.
Nowadays, thanks to the updates of PowerPoint, you can also easily use and modify vector graphics. It will assist you considerably if you would like your slides to be in the style of infographics, or if you want to beautify your slides with relevant illustrations.
How to use vector graphics in PowerPoint?
SVG
Let’s start with the easiest format of vector graphics, SVGs. Though SVGs are not common for more complicated graphics such as infographic vectors or illustrations, they are still very common in the icon category.
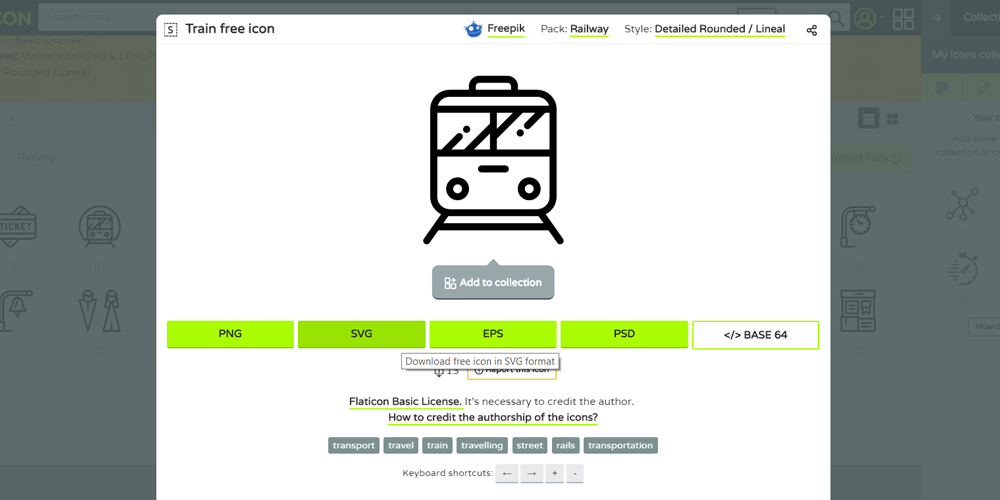
Usually, whenever I need to use icons, I usually download them from Flaticon and choose SVG format.
When the file is already downloaded, you just need to drag-and-drop it directly to your slide deck. In PowerPoint, it is relatively easy to change the color of the icon especially when it is monotone. You just need to change the fill color of the icon, and you can also stretch it to whichever size you want.
EPS
Most of the times, vector graphics are available in EPS format. Let’s start by downloading an infographic template from Freepik:
When the .zip file is downloaded and extracted, you will see the EPS file. As a Window user, I usually just need to locate the EPS file and then drag-and-drop it directly to my slide deck.
However, if there is only AI file available, sometimes you would need to open the file Adobe Illustrator first and drag-and-drop the graphics from Illustrator to PowerPoint (please remember to choose all the graphics in the file, because sometimes the graphics are not grouped).
When you already have your vector graphics in PowerPoint, ungroup it by right click at the graphics and choose Group > Ungroup, or CTRL+SHIFT+G. There will be a box pop-up like this, just click Yes. Remember that you might need to ungroup it several times until you get everything ungrouped.
Now when you have already had everything ungrouped, they will be transformed to Microsoft Office drawing objects. You can modify the objects as much as you want: remove the unnecessary things, change the colors, move the smaller graphics around as desired, add your own text, etc. Now it is much easier to create a presentation in the style of infographics! 🙂
If you want to learn more about the newest features of PowerPoint, stay subscribed! We are updating with lots of information about how to edit shapes and icons in PowerPoint in the near future!


